
Predicting Crop Yield From The Sky - II
01 May 2021
The Long Haul
In Part I we introduced the basics without filling in the blanks. In this post and others we’ll get into the weeds.
Our project was extended over a second and then a third season after too much rain and too little knowledge of how to capture stable images. In the first year we experimented with kites, balloons and home-made cameras, producing thousands of pictures. While these efforts could indicate, roughly, what the health and status of a sugarcane field was on any given day they could not show how one section of crop compared to another, or how one day compared to the next.
Our interest was to discover what vegetation indexes were best at 1) correlating with and 2) predicting sugarcane yield. We assumed the first question would surrender to the least sophisticated method (we were partly right). The second question was harder. It turned out to be far more challenging unless the data captured was of high quality.
A Picture’s Worth
An effective spectral index is built in stages by capturing light of the right band, at the right time of day, in the right part of the season. During our study it became apparent that the ability to place a camera in reproducible position for sufficient time was the key to capturing data that could provide more than a rough assessment of crop health. Likewise, it became clear that the ability to capture in the narrowest band possible with minimum distortion was crucial.
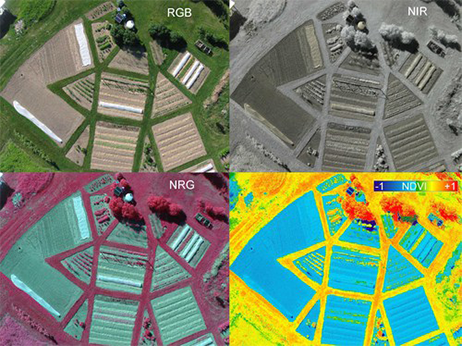
A vegetation index can be created using a consumer digital camera as all consumer sensors are sensitive in the near infrared band of light. If the camera is modified such that one channel captures the visible light and either of the other two channels capture the NIR (by removing the IR blocking filter and inserting a dual band pass filter) then an otherwise ordinary point-n-click can serve as a multi-spectral sensor.